iPAS Exam Preparation Notes - Operational Intelligence Analyst (Entry Level)
After completing two iPAS certifications, I noticed there is another exam for the Operational Intelligence Analyst certification on 2026/10/31. I decided to give it a try, although after reading through the material, I found it to be quite different from what I had imagined. As per my usual practice, after speed-reading the two official handouts, I had AI organize them into notes that I find easier to study. However, this subject lacks past exam papers, making it impossible to estimate potential scores. Furthermore, the handouts only cover basic content, and many exam questions fall within the syllabus but are not explicitly in the handouts. Honestly, this makes me feel a bit uneasy about taking the exam.
Basic Knowledge of Operational Intelligence
Operational Intelligence vs. Business Intelligence
Business Intelligence (BI) is the use of information technology by enterprises to organize actionable information from daily operational data, helping companies improve operational performance and competitiveness.
Operational Intelligence (OI) applies business intelligence to the dynamic systems within an enterprise's operational model. It goes beyond historical reporting, emphasizing fast, real-time, and integrated information flows, organizing key information and critical indicators from processes such as R&D, procurement, production, marketing, finance, accounting, and human resources into a basis for decision-making.
| Concept | Focus | Typical Use |
|---|---|---|
| Business Intelligence (BI) | Collecting, integrating, analyzing, and presenting enterprise data. | Reports, dashboards, trend analysis, KPI tracking |
| Operational Intelligence | Integrating BI analysis into enterprise operational processes to support real-time and multi-dimensional decision-making. | Production planning, sales analysis, financial analysis, HR performance |
| Big Data Analytics | Processing structured, semi-structured, and unstructured data; data-driven. | Social media analysis, customer behavior prediction, smart manufacturing |
Operational Intelligence System Architecture
Operational Intelligence systems typically consist of three layers: the Data Layer, the Integration Layer, and the Analytics Layer. Data is first generated by various operational systems, then enters a data warehouse or data platform for integration, and is finally used for decision-making through analytics engines and data presentation tools.

| Layer | Description | Common Technologies |
|---|---|---|
| Data Layer | Data sources and operational systems. | ERP, CRM, SCM, POS, sensors, external data |
| Integration Layer | Cleaning, transforming, and integrating data from different sources. | Data warehouse, ETL, Metadata Repository |
| Analytics Layer | Analyzing data and creating reports. | OLAP, data mining, statistical analysis, BI tools |
KPIs and the Balanced Scorecard
A Key Performance Indicator (KPI) is a metric used to measure whether an organization is moving toward its goals. One of the tasks of operational intelligence is to identify KPIs for departments, processes, and the overall organization, allowing managers to review, measure, and correct action plans.
The Balanced Scorecard (BSC) is a strategic management method that translates vision and strategy into specific indicators across four perspectives.
| Perspective | Focus Question | Example KPI |
|---|---|---|
| Financial | Does it contribute to shareholders and financial results? | Revenue growth rate, gross margin, ROI |
| Customer | How do customers view the enterprise? | Customer satisfaction, renewal rate, complaint rate |
| Internal Process | Which processes must perform well? | Delivery fulfillment rate, yield rate, process cycle time |
| Learning and Growth | Does the organization have the ability to improve continuously? | Employee training hours, skill coverage, number of innovation proposals |
There is a causal relationship between the four perspectives of the Balanced Scorecard. Learning and growth serve as the foundation; once internal processes improve, they drive customer satisfaction, which is ultimately reflected in financial results. This causal structure is called a Strategy Map.

Applications of Operational Intelligence in Business Management
Operational Intelligence can be applied to enterprise functions such as production, sales, finance and accounting, and human resources. The key is to transform data from various processes into information that supports management actions.
| Enterprise Function | Operational Intelligence Use | Corresponding System |
|---|---|---|
| Production Planning and Control | Tracking production quantities, scheduling, capacity, and actual vs. planned variances. | ERP, MRP, MES |
| Sales and Distribution Analysis | Analyzing customer, order, channel, promotion, and delivery data. | ERP, CRM, SCM, PLM |
| Finance and Accounting | Integrating operational processes and financial data to support management and financial accounting. | ERP Finance/Accounting Module |
| Human Resources | Quantifying HR performance and tracking human resource utilization status. | HRIS, BI dashboards |
Taking sales and distribution as an example, this process often involves multiple systems simultaneously, illustrating how they divide labor.
| System | Role in Sales and Distribution |
|---|---|
| ERP | Stores sales activities, orders, delivery, shipping, invoicing, and master data. |
| CRM | Manages customer attributes, marketing activities, promotions, and channel interaction data. |
| SCM | Supports sales forecasting, distribution networks, inventory, transportation, and order allocation. |
| PLM | Manages product status, features, and lifecycle information, supporting marketing and pricing. |
For the complete definition of each system mentioned in this section, see Common Information Systems for Digital Enterprises later in this document.
Evaluating and Planning Operational Intelligence
Before introducing operational intelligence, one must evaluate whether it can solve current operational problems or support future business directions. Only after evaluation does the project move into planning, confirming whether the enterprise has sufficient technical and non-technical infrastructure.
| Stage | Focus | Description |
|---|---|---|
| Operational Assessment | Identify operational problems to be solved. | E.g., reducing inventory, improving delivery times, increasing customer satisfaction. |
| Cost-Benefit Assessment | Compare benefits with implementation costs. | Benefits can include increased revenue, reduced costs, and increased market share. |
| Risk Assessment | Evaluate project risks. | Technical risks, project complexity, organizational risks, team risks. |
| Infrastructure Assessment | Check implementation conditions. | Hardware, middleware, databases, processes, data, application systems, metadata. |
| Project Planning | Establish plans and schedules. | WBS, task dependencies, resources, critical path, duration. |
Enterprise value can be measured in four directions.
| Question | Measurement Direction | Example |
|---|---|---|
| Better? | Has quality or satisfaction improved? | Higher yield, higher customer satisfaction |
| Cheaper? | Have costs been reduced? | Decreased development, communication, and inventory costs |
| Faster? | Has speed increased? | Production efficiency, time-to-market, service response speed |
| Do more? | Has capability or scope expanded? | New customer sources, market share, number of system users |
Gantt Charts, PERT, and CPM
Operational intelligence projects can be planned, scheduled, and controlled using Gantt charts, PERT, and CPM.
| Tool | Suitable Use | Focus |
|---|---|---|
| Gantt Chart | Simple project scheduling and progress monitoring. | Shows activity time and progress, but is not good at showing activity dependencies. |
| PERT | Estimation when task duration is uncertain. | Uses three time estimates: optimistic, most likely, and pessimistic. |
| CPM | Finding the shortest project completion time and critical path. | Activities on the critical path directly affect the project completion date. |
Common steps for PERT and CPM:
- Define the project and create a Work Breakdown Structure (WBS).
- Identify all activities and their sequence.
- Draw an activity network diagram.
- Assign time and cost estimates to each activity.
- Calculate the longest time path in the entire network.
- Use the network diagram to assist in planning, scheduling, and controlling the project.
PERT Expected Time Formula
Given optimistic time
The formula is essentially a weighted average, with the numerator being
The variance is:
Taking the activity "AI Customer Service Model Training" as an example, the engineer estimates 2 days optimistic (everything goes smoothly), 5 days most likely (normal progress), and 14 days pessimistic (serious errors):
Although 5 days is the most frequent occurrence, the pessimistic time is as long as 14 days, so the weighted expected time is pulled to 6 days, which is the number filled into the network diagram. The standard deviation of 2 days is an input for subsequent risk analysis. However, to answer probability questions like "What is the confidence level of completing within 8 days?", one cannot simply apply a normal distribution to a single activity (a single activity duration approximates a Beta distribution); the standard approach is to first aggregate the means and variances of all activities along the critical path into the completion distribution of the entire project. After summing multiple activities, it approaches a normal distribution according to the Central Limit Theorem, and then the probability is estimated. If the project completion average is 6 days and the standard deviation is 2 days, 8 days is exactly +1 standard deviation, with a probability of about 84% (50% below the mean, plus 34% for 0 to +1σ; see Descriptive Statistics and Common Statistical Concepts for the breakdown).
PERT/CPM Network Diagram Illustration

Each node in the diagram represents an activity (A is start, F is end), and the arrows represent the dependency relationship between activities. The pointed-to activity must wait for all preceding activities to complete before it can start. The number of days on the node is the expected time calculated for each activity using the PERT formula. Summing the days for each path:
- A→B→D→F: 2 + 4 = 6 days
- A→C→D→F: 3 + 4 = 7 days
- A→C→E→F: 3 + 5 = 8 days
The longest path, A→C→E→F, is the critical path (red nodes). The project only ends when all paths are completed, so the total duration is determined by the longest path, which is 8 days. The "shortest completion time" mentioned by CPM refers precisely to the length of this longest path; it cannot be rushed any faster.
Activities on the critical path have no slack. If C or E is delayed by one day, the total duration increases by one day. Activities on non-critical paths have Float. Taking B as an example, D must wait for both B and C to complete. Since D takes 4 days, it can start as late as the 4th day and still finish synchronously with E on the 8th day. Therefore, B can be delayed by up to 2 days without affecting the project duration; exceeding this will push the project back.
Basic Data Analysis
Data Processing Chain
Data must go through a series of processes to transform from raw records into information that can be used for decision-making. The typical flow is that data first enters a database, is then organized into a data warehouse according to analysis purposes, then patterns are found through data mining, and finally, it is presented to decision-makers through visualization.

| Stage | Focus |
|---|---|
| Data | Information that can be recorded, which may be numbers, text, images, or sound. |
| Database | Storing daily operational data. |
| Data Warehouse | Integrating data from multiple sources for analysis purposes. |
| Data Mining | Finding correlations, patterns, trends, or prediction rules. |
| Data Visualization | Presenting analysis results through charts, dashboards, or reports. |
Data Sources and Datafication
Data is not necessarily just numbers; any information that can be recorded can become data. Enterprise data sources include transaction data, customer data, supply chain data, sensor data, customer service records, social media text, images, and video files.
Datafication is the process of converting phenomena that are not easily quantifiable into analyzable data. For example, converting customer service calls into text for sentiment analysis, or converting equipment vibration signals into time series to predict failures.
Structured, Semi-structured, and Unstructured Data
| Data Type | Characteristics | Example | Pros | Limitations |
|---|---|---|---|---|
| Structured Data | Fixed fields, format, and order. | Sales data tables, member data tables | Easy to query, integrate, and analyze. | Low flexibility; data not conforming to field rules is hard to store. |
| Semi-structured Data | Has field concepts, but fields can be added/removed. | CSV, JSON, XML | Easy to exchange and extend. | Fields are not necessarily consistent; higher data governance requirements. |
| Unstructured Data | No fixed fields or fixed format. | Images, videos, Email, web pages, customer service recordings | Can preserve rich content. | Usually requires conversion before analysis; information may be lost during conversion. |
Data Quality and Preprocessing
Data quality directly affects analysis results. Common data quality problems include missing values, duplicate data, inconsistent formats, inconsistent units of measurement, inconsistent field definitions, and outliers.
| Problem | Description | Direction of Handling |
|---|---|---|
| Missing Values | Field not filled or unobtainable. | Imputation, deletion, marking the reason for missing. |
| Duplicate Data | The same entity is recorded repeatedly. | Deduplication, primary key comparison, merging records. |
| Inconsistent Format | Chaotic date, phone, address formats. | Standardizing formats. |
| Inconsistent Units | Mixing kilograms and grams, TWD and USD. | Unifying units and retaining conversion rules. |
| Inconsistent Definition | Different departments define the same field differently. | Establishing a data dictionary and common definitions. |
| Outliers | Outside reasonable range or violating rules. | Investigating the cause, correcting, or retaining and marking. |
Common meanings of data quality:
- Accuracy: Does the data reflect the true state?
- Reliability: Are the data source and production process credible?
- Consistency: Are definitions consistent across different systems or fields?
- Completeness: Are necessary fields complete?
- Relevance: Is the data relevant to the originally set business goals?
Missing Value Handling Methods
Handling missing values is one of the most common tasks in data preprocessing, and different methods are suitable for different scenarios.
| Method | Description | Suitable Scenario |
|---|---|---|
| Listwise Deletion | Directly deleting the entire record containing missing values. | Very low missing ratio; deletion does not affect sample representativeness. |
| Pairwise Deletion | Excluding the record only when the field is used; other analyses still include it. | Multivariate analysis; hope to retain more data. |
| Mean/Median Imputation | Filling with the mean or median of the field. | Numerical fields; use mean for normal distribution, median for skewed distribution. |
| Linear Interpolation | Using known values before and after the missing point for linear interpolation. | Continuous data like time series; retains local trends, avoids flattening changes caused by mean imputation. |
| Mode Imputation | Filling with the most frequent category in the field. | Categorical fields. |
| Regression Imputation | Using other fields to build a regression model to predict missing values. | Missing field has a clear correlation with other fields. |
| KNN Imputation | Filling with the average of the K most similar records. | Clear multi-field features, sufficient samples. |
| Multiple Imputation | Generating multiple sets of possible values and merging analysis results. | High-quality research, complex missing mechanisms. |
| Retain and Mark | Retaining missing, adding an "is missing" flag field. | Missing itself has meaning (e.g., not filling is also information). |
Data Storage: From Databases to Data Lakehouses
| Concept | English | Characteristics |
|---|---|---|
| Database | Database | Stores daily operational (OLTP) data, highly normalized. |
| Data Warehouse | Data Warehouse | Integrates historical data from multiple operational systems, fixed Schema, for enterprise-level analysis. |
| Data Mart | Data Mart | A subset of a data warehouse, focusing on specific departments or themes (e.g., marketing, finance). |
| Data Lake | Data Lake | Stores structured, semi-structured, and unstructured data in raw format; Schema is defined only during analysis (Schema-on-Read). |
| Data Lakehouse | Data Lakehouse | Combines the management capabilities of a data warehouse with the flexibility of a data lake, featuring both ACID transactions and multi-format storage. |

Database vs. Data Warehouse
Both store data, but serve opposite purposes:
- Databases are "operational" oriented, storing current real-time data, frequent writes, and highly normalized to reduce redundancy (corresponds to OLTP).
- Data warehouses are "analysis" oriented, integrating historical data from multiple sources, query-focused, and denormalized to speed up aggregation (corresponds to OLAP).
Databases answer "what is the current state," while data warehouses answer "what is the long-term trend."
ETL and ELT
The foundation of a data warehouse is ETL (Extract, Transform, Load), which is extracting data from source systems, cleaning and transforming it, and then loading it into the data warehouse.
The study guide also uses ECCD to describe the data processing flow:
| Step | English | Description |
|---|---|---|
| Extract | Extract | Taking data from raw data sources. |
| Clean | Clean | Confirming data quality, handling missing, erroneous, and inconsistent data. |
| Conform | Conform | Unifying definitions, formats, and dimensions across data sources. |
| Delivery | Delivery | Delivering usable data to application systems or decision-makers. |

When planning an ETL system, both requirements and architecture must be considered simultaneously.
| Type | Consideration Items |
|---|---|
| Requirements Analysis | Business, regulations, quality, security, integration, schedule, backup, delivery, skills, resources |
| Architecture Design | Tool procurement or self-development, batch or streaming, schedule automation, exception handling, quality control, recovery and restart, metadata, data security |
Differences between ETL and ELT
ETL and ELT consist of the same three steps, but the difference lies in the sequence of Transform and Load, which also changes where Transform is executed:
| Step | ETL | ELT |
|---|---|---|
| Extract | Extract raw data from source systems. | Extract raw data from source systems. |
| Transform | Clean and apply business rules in external tools before loading. | Transform using the platform's computing power after loading. |
| Load | Finally, write the organized clean data into the data warehouse. | First, write raw data directly into the data lake or data lakehouse. |
- ETL is suitable for traditional data warehouses. Taking monthly financial closing as an example, currencies are unified, duplicate transactions are removed, and missing values are filled in an external tool before loading into the warehouse. Data quality is high, but the entire process must be rerun if business rules change.
- ELT is suitable for data lakehouses and cloud data platforms. Taking an operational analysis platform as an example, order, POS, and customer service records are loaded in full, and then financial summaries, sales analysis, and customer segmentation datasets are generated according to needs. Raw data is kept intact, and when new analysis needs arise, one can go back and re-transform without being limited by the initial design.
Why ELT has risen
- Early database storage costs were high, and computing and storage were tied to the same machine; transforming and reducing volume externally before loading was a necessary practice at the time.
- Cloud object storage costs have dropped significantly, making full-volume loading feasible; modern cloud data platforms separate computing from storage, allowing for on-demand scaling of computing power for transformation within the platform.
- ETL's aggregation and cleaning are destructive processes; once raw details are aggregated, they disappear. The need to retain raw data makes ELT a common choice on modern platforms.
OLTP and OLAP
OLTP (Online Transaction Processing) and OLAP (Online Analytical Processing) are two different database operating modes for different purposes.
| Aspect | OLTP | OLAP |
|---|---|---|
| Main Purpose | Processing daily transactions (add, modify, delete) | Analysis and decision support |
| Data Volume | Small per transaction, moderate total | Large amount of historical data |
| Operation Type | Large number of short transactions, frequent writes | Small number of complex queries, read-focused |
| Data Structure | Highly normalized | Denormalized (star, snowflake) |
| Typical System | ERP, POS, order systems | Data warehouse, BI platform |
Five OLAP Operations
Multi-dimensional analysis can be imagined as operating on a Data Cube. Suppose this cube has three dimensions: time (year/month/day), location (country/city), and product. Each cell stores the sales amount for that combination. The five operations are different ways of viewing this cube.
| Operation | English | Description and Example |
|---|---|---|
| Roll-up | Roll-up | Aggregating from fine to coarse along a dimension, e.g., summing daily sales of cities into monthly performance for the whole country. |
| Drill-down | Drill-down | The reverse of roll-up, expanding from coarse to fine, e.g., clicking from national performance to see details by city. |
| Slice | Slice | Fixing a single value for one dimension, taking a plane, e.g., looking only at "2026". |
| Dice | Dice | Setting limits on multiple dimensions, taking a smaller sub-cube, e.g., "2026 × Taipei × Mobile Phone". |
| Pivot | Pivot | Not changing data, only changing the presentation direction of dimensions, e.g., swapping report rows and columns to read from a different perspective. |
The essence of the three sets of operations is different. Roll-up/Drill-down changes the granularity of data; Slice/Dice changes the scope of data; Pivot only changes the presentation angle.
Distinguishing Slice, Dice, and Drill-down
- Slice vs. Dice: Both are filtering data; the difference is only in how many dimensions are fixed. Slice fixes one dimension and takes a plane (3D to 2D); Dice fixes multiple dimensions and takes a sub-cube.
- Drill-down vs. Slice: Both are like narrowing the focus, but Drill-down goes down the same dimension to become finer (changing granularity), while Slice filters out other values of a dimension (changing scope), and the report will have one fewer dimension.
Star Schema and Snowflake Schema
Data warehouses often organize data using Dimensional Modeling, splitting data into two types of tables. The Fact Table is placed in the center, recording measurement numbers of "what happened," such as sales amount and purchase quantity; Dimension Tables surround it, recording the background of these numbers, such as when, where, and which product was purchased. The difference between star and snowflake schemas lies in how dimension tables are arranged.
| Model | Characteristics | Trade-off |
|---|---|---|
| Star Schema | Center is the fact table, surrounded by directly connected dimension tables; dimension attributes are flattened in the same table. | Simple structure, few JOINs, fast queries, but dimension tables have duplicate data. |
| Snowflake Schema | Re-normalizes dimension tables, splitting duplicate attributes into multi-layer sub-dimension tables. | Saves storage, reduces redundancy, but more JOINs, slower queries. |
Taking the product dimension as an example, the star schema flattens product name, category, and category manager into the same product dimension table. This hides a transitive dependency: product determines category, and category determines manager. The star schema tolerates this, so 1,000 electronic products will have the category and manager written 1,000 times. The snowflake schema extracts the category into an independent sub-table, eliminating this transitive dependency, effectively pushing the dimension table to the third normal form (3NF). The cost is an extra JOIN to look up the category name.
Additionally, normalization only affects dimension tables; the structure of the fact table is the same in both models. Fact tables only contain foreign keys and measurement values (e.g., product ID, customer ID, quantity, amount), no descriptive text, so there are no transitive dependencies to split.
Viewing Fact and Dimension Tables with Simulated Data
The sales fact table only has foreign keys and measurement values, no text descriptions:
| Date ID | Product ID | Customer ID | Quantity | Amount |
|---|---|---|---|---|
| 20260301 | 101 | 501 | 2 | 1000 |
| 20260301 | 102 | 502 | 1 | 30000 |
| 20260302 | 101 | 503 | 5 | 2500 |
The star schema's product dimension table flattens descriptive attributes; category and manager will repeat:
| Product ID | Product Name | Category | Category Manager |
|---|---|---|---|
| 101 | Bluetooth Earphones | Electronics | Wang Xiaoming |
| 102 | Laptop | Electronics | Wang Xiaoming |
| 103 | Office Chair | Furniture | Li Dahu |
The snowflake schema extracts the category into a sub-table, the product table only keeps the category ID, and "Electronics/Wang Xiaoming" no longer repeats:
| Product ID | Product Name | Category ID |
|---|---|---|
| 101 | Bluetooth Earphones | C01 |
| 102 | Laptop | C01 |
| 103 | Office Chair | C02 |
| Category ID | Category | Category Manager |
|---|---|---|
| C01 | Electronics | Wang Xiaoming |
| C02 | Furniture | Li Dahu |
Star vs. Snowflake: Three Trade-off Aspects
Star and snowflake schemas each have their strengths. In practice, they are weighed across three aspects:
- Query Speed: Star has fewer JOINs, faster; snowflake has more JOINs, slower.
- Storage Space: Star tolerates duplication, takes more space; snowflake eliminates redundancy, saves more.
- Maintainability: Snowflake keeps duplicate attributes in one place, update one record; star has the same attribute repeated in many rows, requiring all to be changed during updates, potentially causing inconsistencies (update anomalies).
However, in data warehouses, the weight of maintainability is lower than in transactional databases because warehouses are focused on read-based analysis and rarely modify historical data; the update burden caused by star duplication does not occur often. Therefore, most scenarios still prefer the star schema for its fast queries and intuitive SQL, and cloud platforms with low storage costs have further reinforced this choice.
Data Visualization and Chart Selection
The purpose of data visualization is to convey key points to decision-makers using appropriate charts without distorting the data.
The first step in choosing a chart is to think clearly about what relationship you want to express, then pick the corresponding chart.
| Analysis Purpose | Suitable Chart | Description |
|---|---|---|
| Compare Categories | Bar chart, horizontal bar chart | Comparing quantities or sizes of different categories; horizontal bar charts are easier to read when there are many categories. |
| Show Trends | Line chart | Observing changes in values over time. |
| Show Composition | Pie chart, stacked bar chart | Seeing the proportion of parts in a whole; categories should not be too many. |
| Observe Distribution | Histogram, box plot | Histograms show the distribution shape of continuous values; box plots show median, quartiles, and outliers. |
| Observe Correlation | Scatter plot | Observing the relationship between two variables. |
| Show Cross Density | Heat map | Presenting the magnitude of 2D cross-values with color depth, e.g., sales heat by time period × region. |
Bar Chart vs. Histogram
- Bar charts are commonly used for qualitative data, such as product categories, regions, and departments.
- Histograms are commonly used for quantitative data, such as amounts, height, and working hours.
Common Misleading Visualizations
The same data can give completely different impressions depending on how it is drawn. The following are four common misleading techniques.
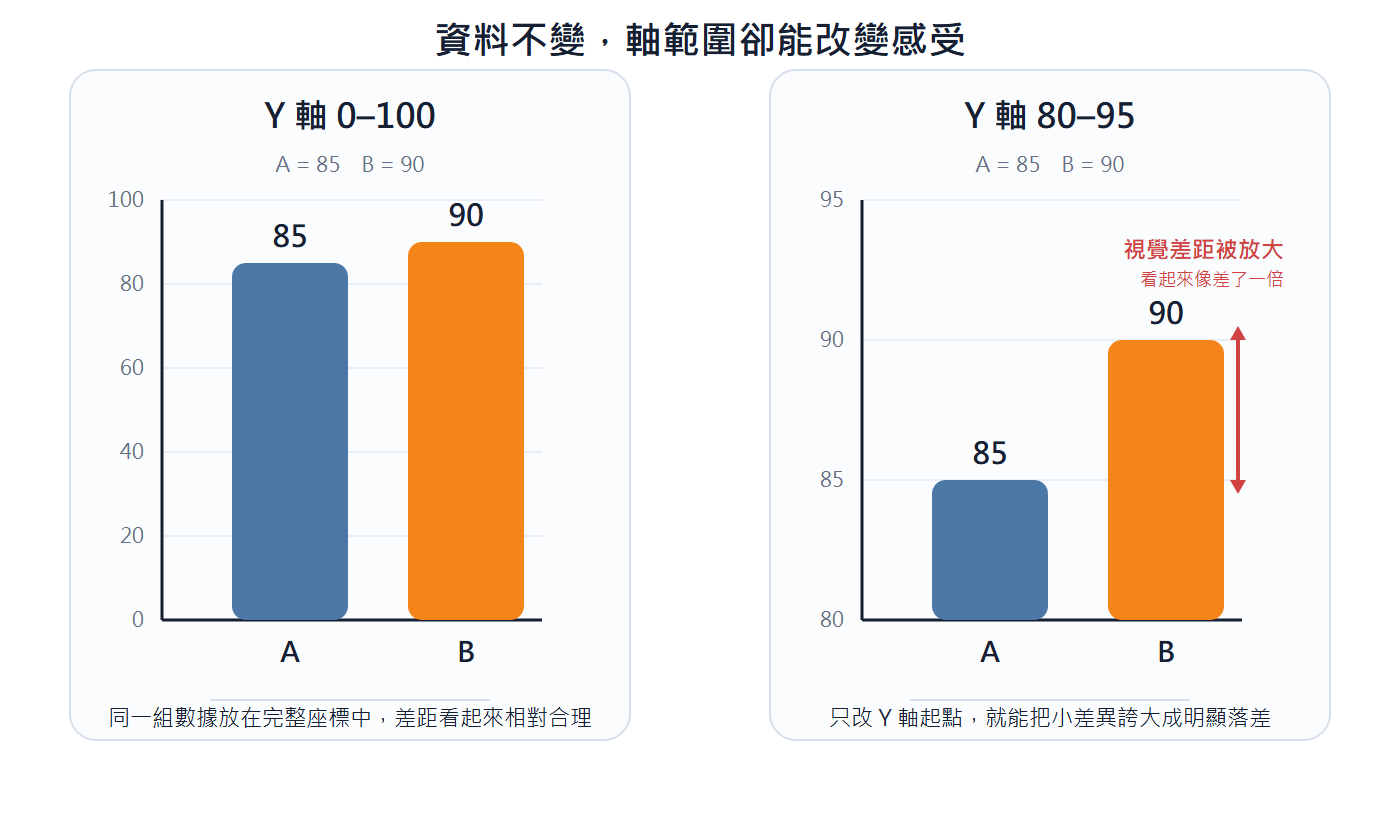
Truncating the Y-axis: If the Y-axis does not start from zero, it will magnify原本微小的差距 (originally small differences). For example, with values 85 and 90, the two bars look almost the same height when the Y-axis is 0 to 100; after changing to 85 to 100, the height difference is severely magnified, and 90 looks far higher than 85. When comparing absolute quantities, the Y-axis should start from zero; when local differences need to be emphasized, the axis range must be clearly marked.
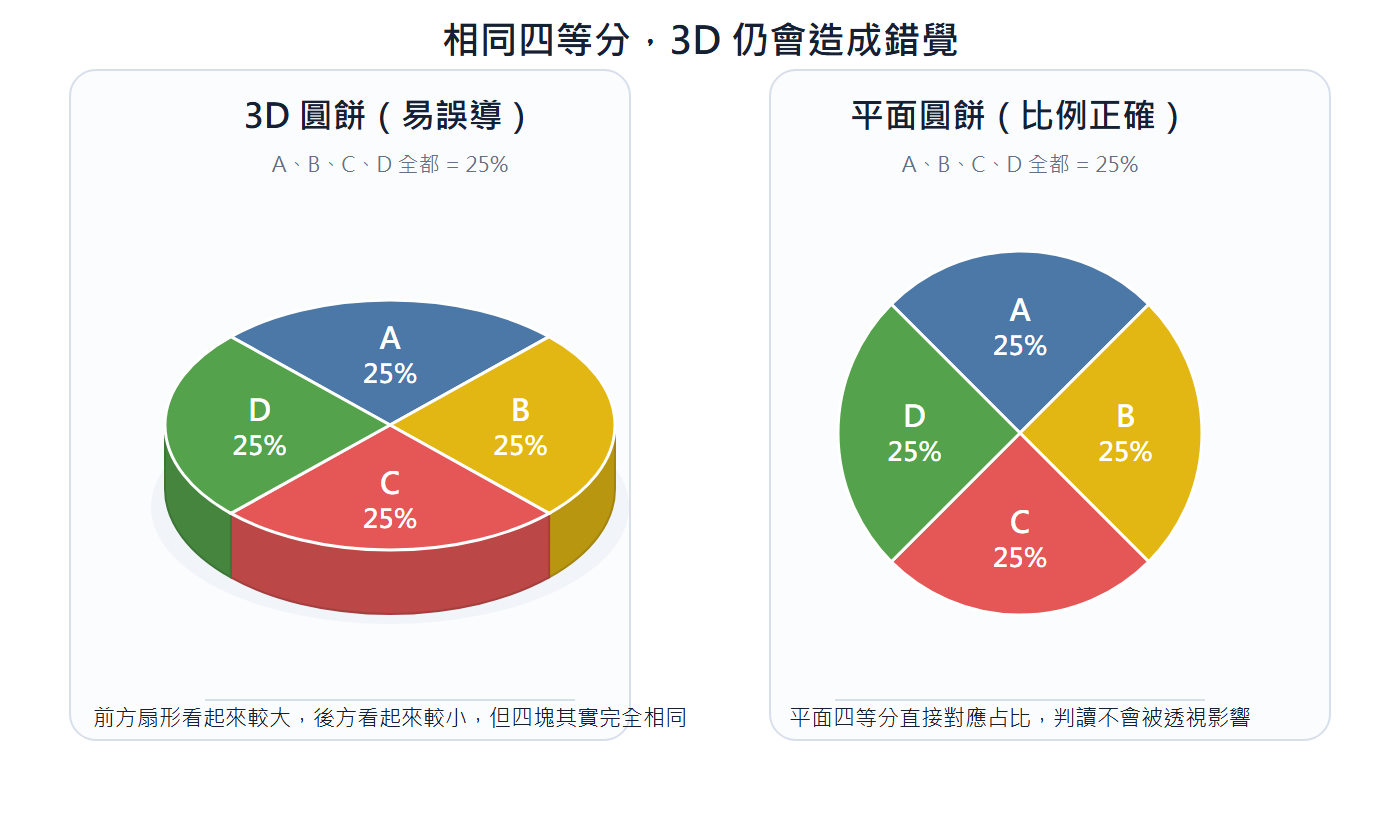
3D Pie Chart: 3D perspective makes the sectors closer to the front appear larger than they actually are due to the angle, while the rear sectors are compressed, leading to distorted proportion interpretation. To show proportions, flat pie charts or bar charts are more accurate than 3D.
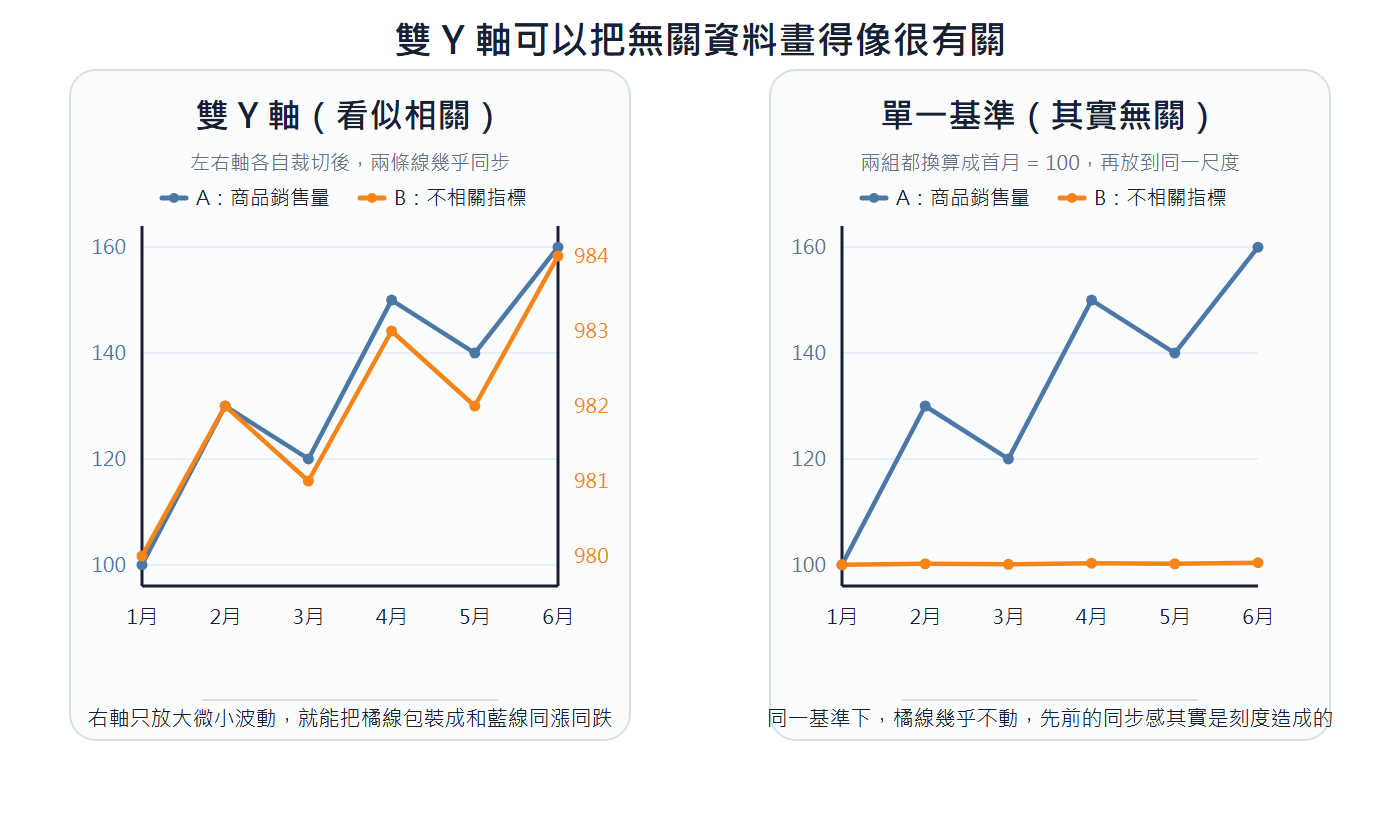
Dual Y-axis: When two sets of data are hung on the left and right Y-axes respectively, the scales of the two axes can be adjusted independently. As long as the right scale is chosen, two lines that are originally unrelated can be made to look like they rise and fall together, implying a correlation that does not exist. To compare two sets of values, use the same baseline to see the true relationship.
Information Overload: Putting too many series or elements in one chart makes it impossible for the reader to grasp the key point. One chart should tell one story.
Descriptive Statistics and Common Statistical Concepts
Data analysis usually starts with descriptive statistics to understand the central tendency, dispersion, and distribution state of the data, and then proceeds to correlation analysis and hypothesis testing.
| Metric | Description | Characteristics |
|---|---|---|
| Mean | Sum of all values divided by the number of records. | Easily affected by extreme values. |
| Median | The value in the middle after sorting. | Suitable for skewed distributions or when extreme values exist. |
| Mode | The value that appears most frequently. | Can also be used for categorical data. |
| Standard Deviation | Measuring the degree of data dispersion. | The larger the standard deviation, the more dispersed the data. |
| Quartiles | Cutting sorted data into four equal parts. | Box plots commonly use Q1, Q2, Q3. |
| Correlation Coefficient | Measuring the direction and strength of linear correlation. | No linear correlation does not mean no relationship; correlation does not mean causation. |
Common statistical and probability concepts:
- Conditional Probability: The probability of one event occurring given that another event has occurred.
- Independent Events: The occurrence of one event does not affect the probability of another event occurring.
- Confidence Interval: Estimating the possible range of population parameters using an interval.
Bayes' Theorem
A reverse application of conditional probability, using new evidence to update original probability judgments. General conditional probability answers "Given that he is a target customer, what is the probability he clicks the ad?"; Bayes' Theorem answers the reverse question, "Given that he clicked the ad, what is the probability he is a target customer?". In practice, most of the evidence that can be directly observed is the latter (clicks, purchases, revisits), so this reverse deduction is the direction commonly used in marketing and customer analysis.
Let's walk through it with concrete numbers. Suppose target customers account for only 10% of the exposed population, and the click-through rate of this ad for target customers is 60%, while it is only 5% for others. Estimating per 1,000 exposures, 60 clicks are expected from target customers (100 people × 60%) and 45 from others (900 people × 5%), totaling 105. Under the condition "given that someone clicked the ad," the probability that they are a target customer is 60 ÷ 105, about 57.1%. This result depends only on those three ratios (prior 10% and two click-through rates), regardless of how many clicks are actually recorded in the backend.
Hypothesis Testing, p-value, and Type I/Type II Errors
Hypothesis testing usually starts by establishing a null hypothesis, which is a conservative stance of "no difference, no effect," such as "the conversion rate of the new webpage is the same as the old version," and then seeing if the data is sufficient to overturn it.
If there is really no difference in conversion rates between the new and old versions, but such a large or even larger gap appears before our eyes, the probability of this situation occurring is the p-value. When the p-value is lower than the pre-set significance level (e.g., 0.05), it means this result is so low that it doesn't look like something that should happen when there is "no difference," thus overturning the null hypothesis. Note that the p-value is not "the probability that the null hypothesis is true," nor is it the size of the effect; these are two of the most common misinterpretations.
Errors can be made whether overturning or not, divided into two types:
- Type I Error (False Positive): The null hypothesis is actually true but is overturned, misjudging "no effect" as "having an effect."
- Type II Error (False Negative): The null hypothesis is actually false but is not overturned, misjudging "having an effect" as "no effect."
And the boundary of this significance level is essentially the upper limit of the Type I error probability one is willing to bear.
t-test, F-test, Chi-square test
Statistical testing uses sample data on hand to judge whether a hypothesis about the population is true; the preceding null hypothesis and p-value are its common judgment logic. Which test to use depends on the data type and the object to be compared. Common ones are the following three.
| Test | Object of Comparison/Verification | Typical Question |
|---|---|---|
| t-test | Mean of one to two groups | Is there a difference in the average transaction amount between two groups of customers? |
| F-test | Variance of two groups (degree of data dispersion) | Is the quality fluctuation of two production lines consistent? |
| Chi-square test | Whether there is a correlation between two categorical variables | Is there a correlation between gender and whether they purchased? |
ANOVA and F-test
To compare the means of three or more groups (e.g., whether the average revenue of three stores is the same), Analysis of Variance (ANOVA) is used, and its test statistic is the F-value. It is called "Analysis of Variance" but compares means because it compares "between-group variance" and "within-group variance." When the between-group difference is significantly larger than the random fluctuation within the group, it is judged that the means of the groups are not all equal.
Empirical Rule and Chebyshev's Theorem
Both answer the same question, "how much data is covered within ±k standard deviations of the mean," the difference being the requirement for the shape of the data.
- The Empirical Rule only applies to data that is approximately normal (bell-shaped symmetric). Because the shape is known, the estimate can be very precise; about 68%, 95%, and 99.7% of the data is covered within ±1, 2, and 3 standard deviations, respectively.
- Chebyshev's Theorem does not require any distribution shape. Because the shape is uncontrollable, it can only give a conservative lower bound; at least
of the data falls within ±k standard deviations of the mean.
The common 75% is calculated by substituting
So, for the same ±2 standard deviations, when data is approximately normal, one can say "about 95%"; when the shape is unknown or clearly skewed, one retreats to citing Chebyshev and says "at least 75%." The former is a precise estimate gained from a beautiful shape, and the latter is a minimum guarantee gained from not picking a shape.
Chebyshev's Theorem Calculation Example
The theorem can be used in two directions.
Given several standard deviations, find the minimum proportion: A factory's daily output averages 500 units, standard deviation 20 units. How much data is covered by at least 460 to 540 units? 460 and 540 are both 40 units from the mean, which is exactly 2 standard deviations (
Given the proportion to be guaranteed, find the interval: A distribution center averages 40 minutes for delivery, standard deviation 8 minutes. To guarantee that at least 84% of orders fall within a symmetric interval, how large should the interval be? Solving
Normal Distribution and Skewness
The shape of the data distribution affects the choice of central tendency metrics and analysis methods.
| Distribution Type | Shape | Relationship between Mean, Median, Mode | Typical Example |
|---|---|---|---|
| Symmetric (Normal) | Bell-shaped symmetric | The three coincide or are very close | Height, weight |
| Right-skewed (Positive) | Long tail on the right, peak on the left | Mode < Median < Mean | Income, housing prices, consumption amount |
| Left-skewed (Negative) | Long tail on the left, peak on the right | Mean < Median < Mode | Retirement age, high-score group in exams |
When data is clearly skewed, the mean is pulled by extreme values at the tail, and the median is usually a more representative central tendency metric.
Data Mining and Machine Learning
Data mining is finding patterns, correlations, and knowledge that can support decision-making from large amounts of data. Common methods include decision trees, cluster analysis, association rule mining, and machine learning.
| Method | Focus | Common Application |
|---|---|---|
| Decision Tree | Using a series of judgment conditions for classification or prediction. | Customer churn prediction, credit risk classification |
| Cluster Analysis | Dividing similar data into groups. | Market segmentation, customer segmentation, product portfolio |
| Association Rule Mining | Finding relationships where items often appear together. | Market basket analysis, cross-selling |
| Regression Model | Predicting continuous numerical targets. | Sales amount prediction, demand prediction |
| Classification Model | Predicting discrete categorical targets. | Whether to churn, whether to default, whether to purchase |
Machine learning can be divided into three categories.
| Type | Data Characteristics | Goal | Example |
|---|---|---|---|
| Supervised Learning | Labeled data. | Learning the mapping from input to answer. | Classification, regression |
| Unsupervised Learning | No manually labeled answers. | Exploring potential structures in data. | Clustering, dimensionality reduction, association exploration |
| Reinforcement Learning | Learning through action and feedback. | Finding strategies that accumulate better rewards. | Dynamic pricing, path planning, resource scheduling |

Regression predicts continuous values (e.g., tomorrow's sales), and classification predicts discrete categories (e.g., whether a customer will churn). Both belong to supervised learning, the difference being the type of target variable.
Data Splitting and Overfitting
When building a model, data is usually split into three parts to prevent the model from "rote memorizing" training data but failing to generalize to new data.
| Split | English | Purpose |
|---|---|---|
| Training Set | Training Set | Letting the model learn parameters from it, about 60-70%. |
| Validation Set | Validation Set | Adjusting hyperparameters, selecting model versions, about 15-20%. |
| Test Set | Test Set | Final evaluation of generalization ability, used only once, about 15-20%. |
| Phenomenon | English | Characteristics | Countermeasure |
|---|---|---|---|
| Overfitting | Overfitting | Good performance on training set, poor on test set; model rote memorizes noise. | Regularization, simplifying model, increasing data, early stopping, cross-validation. |
| Underfitting | Underfitting | Poor performance on both training and test sets; model is too simple. | Increasing features, increasing model complexity, reducing regularization. |
Cross-Validation splits training data into K parts, each time using 1 part for validation and the remaining K-1 parts for training, averaging the results after repeating K times, commonly K=5 or K=10. It can estimate model performance more robustly when data volume is limited.
Regression Model Evaluation Metrics
Regression models commonly use several metrics to measure prediction error, the difference being sensitivity to "large errors" and ease of interpretation.
| Metric | Full Name | Focus |
|---|---|---|
| MAE | Mean Absolute Error | Average of absolute errors; treats every error equally, less affected by extreme values. |
| RMSE | Root Mean Squared Error | Error is squared then square-rooted; magnifies large errors, used when extreme prediction errors must be severely punished. |
| MAPE | Mean Absolute Percentage Error | Expresses error as a percentage; can compare across different magnitudes, but distorts when actual values are close to 0. |
| R² | Coefficient of Determination | Proportion of overall variance explained by the model; looks at overall fit, not a penalty for single-record errors. |
Classification Model Evaluation Metrics
Evaluation of classification models starts from the Confusion Matrix, dividing prediction results into four cells: True Positive (TP), False Positive (FP), True Negative (TN), False Negative (FN), and then calculating metrics from them.
| Metric | English | Algorithm | Question Answered |
|---|---|---|---|
| Accuracy | Accuracy | (TP + TN) ÷ Total | How many were predicted correctly overall? Distorts when classes are unbalanced. |
| Precision | Precision | TP ÷ (TP + FP) | Of those predicted positive, how many are actually positive? |
| Recall | Recall | TP ÷ (TP + FN) | Of those actually positive, how many were caught? |
| F1 Score | F1 Score | Harmonic mean of precision and recall | Comprehensive metric when both need to be balanced. |
Precision and recall usually pull against each other, with trade-offs based on error costs. For example, fraud detection has a high cost for missing, so it favors recall; marketing list mis-sending has a low cost but harasses customers, so it favors precision.
CRISP-DM Data Mining Standard Process
CRISP-DM (Cross Industry Standard Process for Data Mining) is a data mining methodology widely adopted in the industry, containing six stages, which can backtrack to the previous stage as needed.

Data Mining Process Methodology Comparison
Besides CRISP-DM, KDD (Knowledge Discovery in Databases) and SEMMA are also common data mining processes. KDD appeared earlier and is more academic; SEMMA was proposed by SAS, with the name taken from the initials of the five stages: Sample, Explore, Modify, Model, Assess. The goals of the three are similar, the difference being in stage division and orientation.
| Methodology | Stages | Orientation |
|---|---|---|
| CRISP-DM | Business Understanding → Data Understanding → Data Preparation → Modeling → Evaluation → Deployment | Business-oriented; starts with business goals, ends with deployment. |
| KDD | Selection → Preprocessing → Transformation → Data Mining → Interpretation and Evaluation | Data technology perspective, academic-oriented. |
| SEMMA | Sample → Explore → Modify → Model → Assess | Tool operation level, lacks business understanding and deployment stages. |
Business Management Basic Knowledge
Business Environment and Strategic Management
Enterprises must evaluate the environment because organizational strategy, organizational structure, and market performance are all affected by the environment. Chandler's linkage theory can be simplified as "Environment → Strategy → Structure."
| Perspective | Description |
|---|---|
| Strategic Perspective | Organizations adopt different strategies in stages such as startup, growth, maturity, and decline. |
| Market Perspective | Organizations turn inputs into outputs and must master the market to survive and grow. |
| Competitive Perspective | Enterprises must provide outputs more attractive than competitors and continue to profit. |
The enterprise environment can be divided into internal and external environments.
| Type | Factors |
|---|---|
| Internal Environment | Shareholders, board of directors, organizational culture, organizational structure, employee attitudes and values, management procedures and methods |
| Specific Environment | Customer groups, suppliers, competitor groups, financial institutions, shareholder groups, government, pressure groups |
| General Environment | Economy, politics and law, social culture, technology, population structure, natural ecology, internationalization |
PEST and PESTEL Analysis
PEST/PESTEL is a common framework for analyzing the general environment, systematically taking stock of external influencing factors from multiple aspects.
| Abbreviation | Aspect | Content |
|---|---|---|
| P | Political | Government policies, political stability, trade agreements. |
| E | Economic | GDP, interest rates, exchange rates, inflation, consumption power. |
| S | Social | Population structure, culture, lifestyle, education level. |
| T | Technological | Technology trends, R&D investment, automation, intellectual property. |
| E | Environmental | Climate change, sustainability regulations, energy, pollution (added in PESTEL). |
| L | Legal | Labor laws, consumer protection, fair trade, industry regulations (added in PESTEL). |
PEST is the original version, and PESTEL (also called PESTLE) adds environmental and legal aspects, responding to the increasing importance of sustainable development and regulatory compliance issues.
Competition and Strategy Analysis Frameworks
Porter's Five Forces analysis is used to evaluate industry competitive pressure. All five forces are related to the enterprise's specific environment.
| Five Forces | Core Question | Situation where this force is stronger |
|---|---|---|
| Supplier Bargaining Power | Can suppliers raise prices or lower supply conditions? | Suppliers are concentrated, few alternative sources, high switching costs, suppliers can integrate forward. |
| Customer Bargaining Power | Can customers lower prices or demand more services? | Buyers are concentrated or purchase in large volumes, products are standardized, low switching costs, buyers can integrate backward. |
| Threat of New Entrants | Is it easy for new entrants to enter the market? | Low entry barriers, such as economies of scale, brand, capital, channels, and regulatory barriers are all not high. |
| Threat of Substitutes | Can other products or services replace existing needs? | Substitutes have high price-performance ratios, low customer switching costs. |
| Rivalry Among Existing Firms | Is competition within the industry intense? | Many competitors of similar strength, industry growth is slowing, fixed or exit barriers are high, product differences are small. |

The four arrows in the diagram point to the central rivalry among existing firms because the other four forces affect the intensity of competition within the industry. However, rivalry among existing firms is also one of the five forces; the five together determine the competitive intensity and profit space of the entire industry.
Porter's Three Competitive Strategies
After completing the Five Forces analysis, enterprises can choose corresponding competitive strategies based on the industry situation.
| Strategy | English | Focus | Suitable Scenario |
|---|---|---|---|
| Cost Leadership | Cost Leadership | Providing the lowest cost at the same quality, winning through economies of scale and efficiency. | Mass market, price-sensitive customers. |
| Differentiation | Differentiation | Providing products or services with unique value, customers are willing to pay a premium. | Brand, design, technology, or service has differentiation potential. |
| Focus | Focus | Targeting a specific market segment, adopting cost or differentiation strategies within that segment. | Niche market, specific group, or geographic area. |
SWOT analysis is used to take stock of internal and external conditions.
| Type | Source | Description |
|---|---|---|
| Strengths | Internal | Favorable conditions possessed by the organization. |
| Weaknesses | Internal | Deficiencies or limitations within the organization. |
| Opportunities | External | Favorable factors in the external environment. |
| Threats | External | Unfavorable factors in the external environment. |
TOWS Matrix (Strategic Deduction of SWOT)
SWOT only takes stock of the status quo; the TOWS Matrix further crosses internal and external factors to produce four strategic directions.
| Strategy | Combination | Direction |
|---|---|---|
| SO Strategy (Offensive) | Strengths + Opportunities | Use internal strengths to seize external opportunities. |
| WO Strategy (Reinforcement) | Weaknesses + Opportunities | Reinforce internal weaknesses to seize opportunities. |
| ST Strategy (Defensive) | Strengths + Threats | Use strengths to resolve external threats. |
| WT Strategy (Retreat) | Weaknesses + Threats | Downsize, transform, or exit to avoid double pressure. |
The BCG Matrix analyzes business units using market growth rate and relative market share.
| Type | Market Growth Rate | Relative Market Share | Management Implication |
|---|---|---|---|
| Star | High | High | Needs investment to maintain growth. |
| Cash Cow | Low | High | Maturity stage, stable cash flow. |
| Question Mark | High | Low | Need to evaluate whether to increase investment to expand market share, otherwise abandon/exit. |
| Dog | Low | Low | Usually need to downsize, transform, or exit. |

Ansoff Growth Matrix
The Ansoff Matrix deduces four growth strategies from the new/old combinations of the two dimensions of "product" and "market."
| Strategy | Product × Market | Description |
|---|---|---|
| Market Penetration | Existing Product × Existing Market | Increase purchase frequency of existing customers or market share. |
| Market Development | Existing Product × New Market | Expand existing products to new regions or new customer groups. |
| Product Development | New Product × Existing Market | Launch new products or new features for existing customers. |
| Diversification | New Product × New Market | Highest risk, stepping into new fields. |
Manufacturing vs. Service Industries
| Aspect | Manufacturing | Service |
|---|---|---|
| Output | Tangible products. | Intangible services. |
| Management Focus | Cost, quality, customization, and production efficiency. | Customer experience, process quality, and service consistency. |
| Quality Recognition | Easier to measure with objective specifications. | Often affected by interaction context and customer subjective feelings. |
| Customer Participation | Customers are usually not present during production. | Service provision and consumption often occur simultaneously. |
Service industries have four common characteristics:
- Intangibility: Services cannot be touched like physical products.
- Inseparability: Service provision and consumption often occur simultaneously.
- Variability: Service quality is affected by personnel, customers, and context.
- Perishability: Unused service capacity cannot be stored.
Marketing and Product Management
Marketing is about creating exchange value, satisfying customer needs, and supporting enterprise profit. Common themes include marketing mix, consumer behavior, purchasing procedures, market segmentation, and product lifecycle.
Marketing Mix 4Ps
| 4P | Description |
|---|---|
| Product | Goods, services, brand, and added value provided to customers. |
| Price | Pricing strategy, discounts, and payment terms. |
| Place | How the product reaches the customer. |
| Promotion | Advertising, sales promotion, public relations, and sales communication. |
4Ps Corresponding to 4Cs (Customer Perspective)
4Ps are from the enterprise perspective; 4Cs were proposed by Robert Lauterborn, reinterpreting the marketing mix from the customer's angle.
| 4P | 4C | Perspective Conversion |
|---|---|---|
| Product | Customer Value | From "what product we make" to "what value the customer needs." |
| Price | Cost | From "how much to price" to "total cost paid by the customer." |
| Place | Convenience | From "where to stock" to "is it convenient for the customer to obtain." |
| Promotion | Communication | From "one-way advertising" to "two-way communication." |
STP Marketing Strategy
STP is the core process of marketing strategy, connecting market analysis and marketing mix design.
| Step | English | Description |
|---|---|---|
| Segmentation | Segmentation | Dividing the market into different segments based on geographic, demographic, psychological, behavioral, and other variables. |
| Targeting | Targeting | Selecting the target customer group the enterprise wants to serve from the segments. |
| Positioning | Positioning | Establishing a differentiated brand impression and value proposition in the minds of the target customer group. |
Purchaser Decision Consumption Procedure
- Need generation.
- Information collection.
- Evaluation of need solutions.
- Purchase decision.
- Post-purchase satisfaction evaluation.
Factors Influencing Purchasing Decisions
Consumer purchasing decisions are affected by multi-level factors, and marketing strategies need to be designed based on the dominant factors of the target customer group.
| Level | Factors |
|---|---|
| Cultural Factors | Culture, subculture, social class. |
| Social Factors | Reference groups, family, roles, and status. |
| Personal Factors | Age, occupation, economic status, lifestyle, personality. |
| Psychological Factors | Motivation, perception, learning, beliefs, and attitudes. |
Product Lifecycle
| Stage | Characteristics | Management Focus |
|---|---|---|
| Introduction | Market acceptance is still low, sales volume is limited. | Build awareness, lower entry barriers. |
| Growth | Sales volume increases rapidly, new users join, profit climbs simultaneously. | Expand market, increase market share. |
| Maturity | Market is stable, sales reach peak, but competition intensifies, profit has passed its peak and started to decline. | Control costs, differentiation, maintain cash flow. |
| Decline | Demand drops, product may be replaced. | Decide to eliminate, transform, or maintain niche market. |
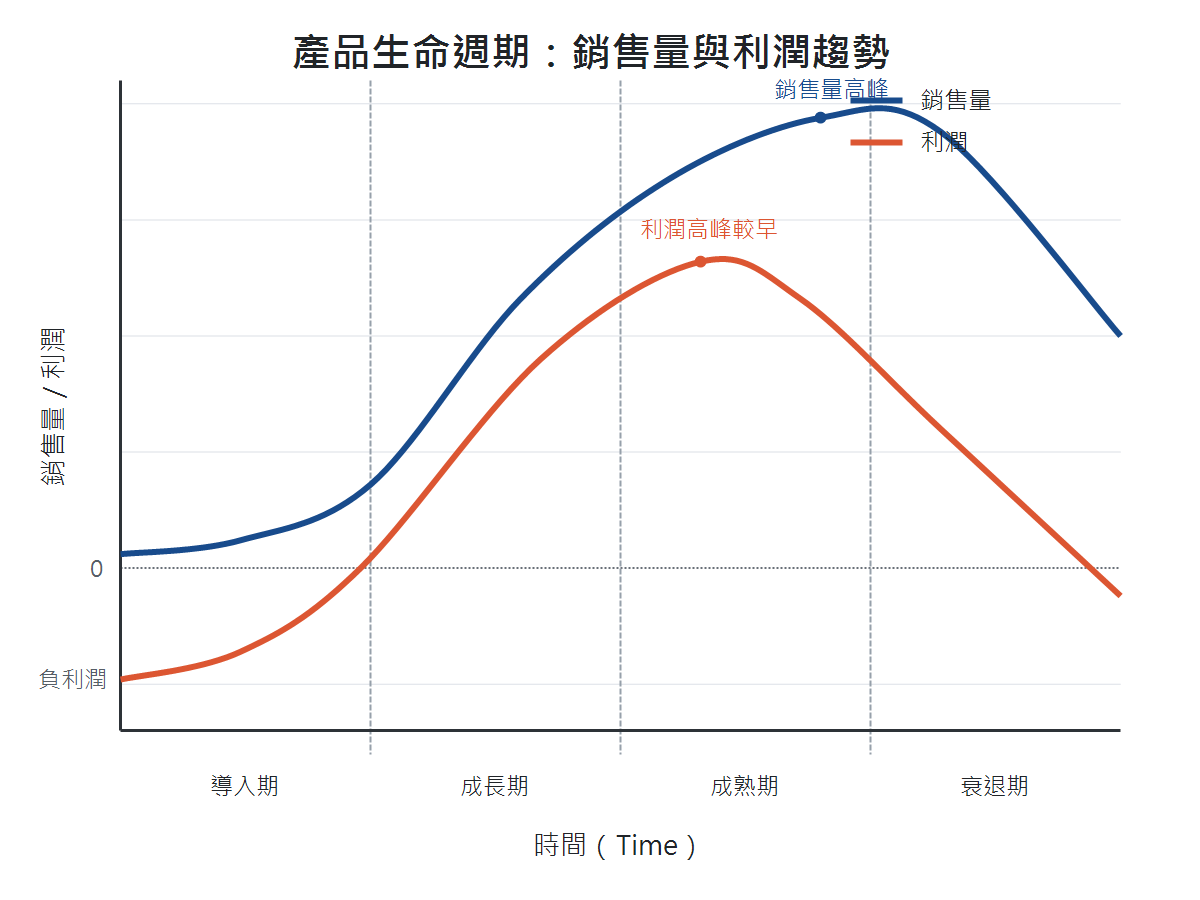
Plotting the sales volume and profit curves for the four stages shows that the profit peak usually occurs earlier than the sales volume peak. In the latter part of the growth stage, competition is not yet intense, and costs have decreased with scale expansion, so profit hits the top first; after entering the maturity stage, although sales volume climbs to the highest, competition intensifies, prices and gross margins decline, and profit has already started to fall back.
Product Diffusion: Types of Innovation Adopters (Rogers' Diffusion of Innovations)
Everett Rogers divided consumers into five types based on the timing of adopting new products, presenting a normal distribution.
| Type | English | Proportion | Characteristics |
|---|---|---|---|
| Innovators | Innovators | 2.5% | Willing to try new things, tolerate high risk and imperfection. |
| Early Adopters | Early Adopters | 13.5% | Opinion leaders, influence subsequent group adoption decisions. |
| Early Majority | Early Majority | 34% | Adopt after deep thought, value practicality and word-of-mouth. |
| Late Majority | Late Majority | 34% | Follow up only after the majority have adopted, more conservative. |
| Laggards | Laggards | 16% | Tradition-oriented, accept or reject adoption last. |
Research & Development and Human Resources
Research & Development (R&D) is an important activity for enterprises to maintain innovation and competitiveness, containing two major aspects: research and development.
| Type | Description |
|---|---|
| Basic Research | Developing and verifying theories; results may or may not have practical application value. |
| Applied Research | Turning basic research results toward concrete applications and problem-solving. |
| Development and Engineering Design | Systematically applying knowledge and research results to products or services. |
| Experimental Production | Small-batch trial production to confirm design, molds, materials, quality, and delivery issues. |
R&D has non-routine nature and high risk. Investing resources does not guarantee the generation of patents, products, or market success, and one must face tests of mass production, marketing, channels, and customer acceptance.
Human resource management includes activities such as recruitment and selection, training and development, personnel movement, performance evaluation, rewards, and human resource retention.
| Activity | Focus |
|---|---|
| Human Resource Planning | Understanding existing human resource supply, evaluating future demand, planning supply-demand gaps. |
| Selection | Finding suitable candidates through resumes, interviews, written tests, and background checks. |
| Employee Training | Stimulating self-learning, practice-oriented, employee participation, real-time feedback. |
| Performance Evaluation | Identifying performance problems, consequences, and improvement plans. |
| Compensation and Benefits | Includes monetary rewards and non-monetary rewards. |
Accounting, Finance, and Financial Metrics
The difference between accounting and financial management lies in the time perspective and work focus.
| Item | Accounting | Financial Management |
|---|---|---|
| Time Perspective | Focused on historical information organization and reporting. | Focused on future fund planning and financial decisions. |
| Work Focus | Recording, aggregating, reporting transaction activities. | Investment, financing, fund utilization, and risk management. |
| Users | Internal managers and external information users. | Managers, investors, creditors, etc. |
| Metric | Type | Description |
|---|---|---|
| Marginal Profit Rate | Profitability | Measuring how much profit is left per unit of sales. |
| Return on Investment (ROI) | Profitability | Measuring the return brought by investment. |
| Earnings Per Share (EPS) | Profitability | Earnings corresponding to each share of common stock. |
| Current Ratio | Solvency | Measuring short-term debt repayment ability, not a profitability metric. |
| Inventory Turnover | Operational Efficiency | Measuring the speed of inventory conversion. |
EOQ Economic Order Quantity Formula
Given annual demand
EOQ is the single order quantity that minimizes the sum of "ordering costs" and "holding costs," assuming stable demand, fixed lead time, and immediate replenishment.
Management Activities and Organization
Management is the process by which managers use organizational resources to achieve goals.
Achieving goals and using resources correspond exactly to the two aspects of measuring management performance:
- Effectiveness: Whether the goal is appropriate, whether the right things are done.
- Efficiency: The relationship between input and output, whether results are achieved with fewer resources.
Managers can be divided into first-line managers, middle managers, and top managers by level.

Different levels require different proportions of skills. First-line managers focus on technical skills, top managers focus on conceptual skills, and interpersonal skills are important at all levels.
| Manager Skills | Description | Commonly Found In |
|---|---|---|
| Technical Skills | Using professional knowledge to perform work. | First-line managers need more. |
| Interpersonal Skills | Communication, cooperation, motivation, and leadership. | All levels need. |
| Conceptual Skills | Analyzing problems, evaluating plans, planning actions. | Top managers need more. |
| Political Skills | Building power bases and interest linkages. | Important when involving cross-departmental coordination. |
Mintzberg's managerial roles can be divided into three categories.
| Type | Role |
|---|---|
| Interpersonal Roles | Figurehead, leader, liaison |
| Informational Roles | Monitor, disseminator, spokesperson |
| Decisional Roles | Entrepreneur, disturbance handler, resource allocator, negotiator |
Four functions of enterprise management:
| Function | Description |
|---|---|
| Planning | Defining goals, formulating strategies and plans. |
| Organizing | Allocating resources, arranging work, and establishing responsibility relationships. |
| Leading | Motivating, communicating, coordinating, and handling conflicts. |
| Controlling | Monitoring performance, comparing goal and actual gaps, taking corrective measures. |
PDCA Cycle (Deming Cycle)
PDCA is the foundation cycle for quality management and continuous improvement, proposed by Walter Shewhart and promoted by W. Edwards Deming, often regarded as the execution model of the four management functions.

| Stage | Corresponding Management Function | Focus |
|---|---|---|
| Plan | Planning | Defining problems, setting goals, formulating action plans. |
| Do | Organizing + Leading | Executing according to plan, recording processes and data. |
| Check | Controlling | Evaluating effectiveness, identifying gaps with goals. |
| Act | Controlling + Planning | If successful, standardize; if not, correct and restart the cycle. |
The extended version PDSA (Plan-Do-Study-Act) replaces "Check" with "Study," emphasizing in-depth analysis rather than simple checking. Six Sigma's DMAIC (Define, Measure, Analyze, Improve, Control) is an advanced version more focused on quality improvement projects.
Digital Enterprise Information Tools Basic Knowledge
Digital Enterprise and Digital Transformation
A digital enterprise is one that can use digital technology and information networks to communicate, collaborate, conduct electronic transactions, share data, and transform processes with customers, suppliers, and business partners. The focus of digital transformation is not just introducing tools, but changing operational processes, service delivery methods, and value creation models.

Operational Intelligence Information Technology
| Technology | Focus | Operational Intelligence Application |
|---|---|---|
| AI | Supporting analysis and decision-making through machine learning, deep learning, and NLP. | Customer behavior prediction, inventory risk analysis, social media sentiment analysis. |
| Generative AI | Automatically generating text, images, and code using Large Language Models (LLM) and diffusion models. | Marketing copy, customer service dialogue, report summary, SQL auto-generation, knowledge Q&A. |
| Cloud Computing | Obtaining computing, storage, and platform resources on-demand via the network. | Expanding data platforms, reducing peak resource procurement pressure. |
| RFID | Tracking and identifying objects through radio frequency signals. | Material tracking, inventory counting, automated warehouse entry/exit. |
| IoT | Connecting sensors, equipment, and networks. | Equipment monitoring, smart logistics, smart agriculture, environmental monitoring. |
| Big Data | Processing data with high volume, velocity, variety, and uncertainty. | Marketing analysis, production risk analysis, customer insight. |
Big Data 5V Characteristics
| V | Chinese | Description |
|---|---|---|
| Volume | 量大 | Data volume reaches TB, PB levels. |
| Velocity | 速度快 | High frequency generation and processing requirements. |
| Variety | 多樣性 | Structured, semi-structured, unstructured coexist. |
| Veracity | 真實性 | Data quality and credibility vary. |
| Value | 價值 | Finding parts in massive data that can be converted into business decisions. |
The iPAS official study guide lists 4V (Volume, Velocity, Variety, Veracity) for big data characteristics; Value is an extension common in other textbooks, collectively called 5V.
AI / ML / DL / GenAI Scope Relationship

The diagram is a simplified scope inclusion relationship. ML is a subset of AI, DL is a subset of ML, and the current mainstream GenAI is also implemented using deep learning.
There are three standard cloud service models defined by NIST: IaaS, PaaS, and SaaS; the table below also lists FaaS, which is common in serverless architectures, though it is not one of the three NIST standards.
| Service Model | Full Name | Supplier Management Scope | Customer Management Scope | Typical Service |
|---|---|---|---|---|
| IaaS | Infrastructure as a Service | Physical machine, network, storage, virtualization | OS, middleware, execution environment, application, data | AWS EC2, Azure VM, GCP Compute Engine |
| PaaS | Platform as a Service | IaaS scope + OS, middleware, execution environment | Application, data | Heroku, Azure App Service, AWS Elastic Beanstalk |
| FaaS | Function as a Service | PaaS scope + execution environment management, auto-scaling | Function code, trigger settings | AWS Lambda, Azure Functions, GCP Cloud Functions |
| SaaS | Software as a Service | PaaS scope + application | Data (user operation level) | Gmail, Microsoft 365, Salesforce |
NIST also defines four deployment models, describing who the cloud infrastructure is for:
| Deployment Model | Description |
|---|---|
| Public Cloud | Operated by cloud service providers, open for general public rental, multi-tenant shared resources. |
| Private Cloud | Dedicated to a single organization, can be self-built or outsourced, highest control and isolation. |
| Community Cloud | Shared by multiple organizations with common needs (e.g., regulations, security). |
| Hybrid Cloud | Combining two or more deployment models, e.g., using private cloud normally, scaling to public cloud during peaks. |
RFID systems include electronic tags, card readers, and application systems. Electronic tags are divided into active and passive:
| Type | Power Source | Characteristics |
|---|---|---|
| Active RFID | Built-in battery. | Can actively send data, sensing range is larger. |
| Passive RFID | No built-in battery. | Generates current through electromagnetic induction after receiving card reader signals, sensing range is smaller. |
IoT three-layer architecture:
| Level | Description |
|---|---|
| Perception Layer | Embedding components with sensing, identification, and communication capabilities into objects. |
| Network Layer | Receiving information and processing it through wired or wireless transmission. |
| Application Layer | Combining data with industry scenarios to provide specific services. |

Organizational Levels of Information Systems
Enterprise information systems can be classified by the organizational level they serve, forming a pyramid structure from base-level daily transactions to high-level strategic decision-making. The higher the level, the more aggregated the data and the more unstructured the decisions faced.

| System | Chinese | English Full Name | Service Level | Focus |
|---|---|---|---|---|
| TPS | Transaction Processing System | Transaction Processing System | Operational | Recording and processing daily operational transactions, such as orders, shipping, invoicing, payroll. |
| MIS | Management Information System | Management Information System | Management | Aggregating TPS transaction data, generating routine management reports and summaries. |
| DSS | Decision Support System | Decision Support System | Management | Supporting semi-structured decision-making with interactive models and analysis tools. |
| EIS | Executive Information System | Executive Information System | Strategic | Integrating internal/external information, supporting high-level strategic decisions with dashboards (also called ESS). |
| ES | Expert System | Expert System | Cross-level | Organizing specific domain expert knowledge into a rule base to assist judgment and diagnosis. |
Structured, Semi-structured, and Unstructured Decisions
Decisions are divided into three types based on "whether there is a clear processing procedure," which is also the basis for information system layering:
- Structured decisions: Clear rules and steps, repeatable, can even be automated, such as inventory replenishment, payroll calculation. Mostly handled by TPS/MIS.
- Semi-structured decisions: Partially have rules, partially require human judgment, such as budget compilation, marketing resource allocation. This is the home field of DSS.
- Unstructured decisions: Problems are novel, no ready-made procedures, highly dependent on experience judgment, such as new business investment, mergers and acquisitions. Mostly fall into the EIS at the strategic level.
The higher up the pyramid, the more unstructured the decisions become.
TPS is the data foundation for other systems; MIS and DSS both rely on transaction data accumulated by TPS. The difference between MIS and DSS is that the former generates fixed-format routine reports to answer "what happened," while the latter performs interactive analysis through models to answer "what if we do this." The functional systems in the next section, such as ERP, CRM, and SCM, span multiple levels, containing both transaction processing and report analysis capabilities internally.
Common Information Systems for Digital Enterprises
| System | Chinese | English Full Name | Core Purpose |
|---|---|---|---|
| ERP | Enterprise Resource Planning | Enterprise Resource Planning | Integrating internal enterprise finance, manufacturing, production, sales, HR, and other processes and data. |
| MRP | Material Requirements Planning | Material Requirements Planning | Calculating raw material procurement and production needs based on production schedules and bills of materials. |
| MES | Manufacturing Execution System | Manufacturing Execution System | Connecting production schedules and on-site equipment, real-time grasp of work orders, output, and quality. |
| PLM | Product Lifecycle Management | Product Lifecycle Management | Managing data and processes of products from design, R&D, mass production to elimination. |
| SCM | Supply Chain Management | Supply Chain Management | Managing supply chain upstream and downstream planning and execution. |
| CRM | Customer Relationship Management | Customer Relationship Management | Managing customer data, interactions, sales channels, and service records. |
| EC | Electronic Commerce | Electronic Commerce | Supporting electronic transactions, information sharing, and relationship maintenance. |
| KM | Knowledge Management | Knowledge Management | Supporting storage, retrieval, creation, transfer, and application of organizational knowledge. |
| BI | Business Intelligence | Business Intelligence | Collecting, integrating, analyzing, and presenting data to support decision-making. |
| RPA | Robotic Process Automation | Robotic Process Automation | Automatically executing tasks with clear rules and high repetition using software robots. |
| HRIS | Human Resource Information System | Human Resource Information System | Managing recruitment, attendance, payroll, assessment, and personnel data. |
ERP
ERP is a finance and accounting-oriented integrated information system used to plan, control, and integrate enterprise resources and information from order taking, manufacturing, shipping to settlement reports. It usually consists of integrated software modules and a centralized database.
Common ERP modules include:
- Finance and Accounting.
- Human Resources.
- Manufacturing and Production.
- Sales and Marketing.
- Procurement and Inventory.
- Supply Chain Management.
Manufacturing Information Systems: MRP, MES, and PLM
There are several information systems in the manufacturing field that often appear together, dividing labor and collaborating. ERP evolved from MRP (MRP → MRP II → ERP); MES and PLM are complementary systems connected to ERP, focusing on on-site execution and product/engineering data management respectively.
| System | Positioning | Relationship with ERP |
|---|---|---|
| MRP | Calculating material procurement and production schedules based on master production schedules and bills of materials (BOM). | The predecessor of ERP, later expanded to MRP II covering capacity and finance, then evolved into ERP. |
| MES | Connecting ERP production plans and on-site equipment, real-time reporting of work order progress, output, and quality. | Fills the execution gap between ERP and on-site machines, and feeds actual production data back to ERP. |
| PLM | Managing engineering data and processes of products from design, R&D, mass production to elimination. | Provides product master data and BOM sources for ERP and MES to reference. |
MRP solves "when to prepare how much material," MES solves "how the site is actually performing," and PLM solves "how to manage product data itself." After connecting with ERP, they constitute a complete information chain for manufacturing from order taking, material preparation, production to shipping.
"Predecessor" means absorbed, not replaced
In information systems, saying MRP is the "predecessor" of ERP means that MRP's functions are covered by the broader ERP and become one of its modules, not that MRP disappeared after being replaced by another system. Therefore, ERP itself contains MRP's material calculation functions, and independent MRP systems are almost never seen on the market.
MES and PLM coexist with ERP because the three have different scopes and levels, each performing its own duties, exchanging data through interfaces rather than replacing each other. So ERP and MRP have an "inclusion" relationship, while ERP and MES/PLM have a "partner" relationship.
SCM
The supply chain includes participants such as suppliers, manufacturers, retailers, and logistics in the process of products or services from raw materials to delivery to customers.
SCM systems can be divided into supply chain planning and supply chain execution:
- Supply Chain Planning: Demand forecasting, material requirements, production planning, logistics distribution planning.
- Supply Chain Execution: Managing the flow of products from distribution centers to warehouses and customers.
Supply chains can be divided into three types based on "what triggers production":
| Type | Production Trigger | Trade-off |
|---|---|---|
| Push | Produce based on demand forecasts, then push to channels. | Inventory ready, fast shipping, but forecast errors cause surplus or shortages. |
| Pull | Produce or assemble only after receiving actual orders. | Low inventory, no overproduction, but customer waiting lead time is longer. |
| Push-Pull | Front end pushes based on forecasts, back end pulls based on orders. | Combines the efficiency of push with the flexibility of pull. |
The key to push-pull is the "push-pull boundary point." Before the boundary point, common parts or semi-finished products are prepared based on forecasts (push), and after receiving orders, final assembly or customization is done according to customer specifications (pull). For example, computer manufacturers prepare standard parts, and after receiving orders, assemble them according to configurations; the front end enjoys scale efficiency, and the back end retains customization flexibility.
Electronic Commerce
Electronic commerce is business activity supported by ICT to share information, execute transactions, and maintain relationships between buyers and sellers.
| Type | Full Name | Description |
|---|---|---|
| B2B | Business to Business | Business to business, both buyers and sellers are businesses, such as procurement platforms between enterprises and suppliers, raw material trading platforms. |
| B2C | Business to Consumer | Enterprises sell goods or services directly to consumers, such as online bookstores, brand official e-commerce. |
| C2B | Consumer to Business | Consumer-led, enterprise-responsive, such as group buying to gather bargaining power, consumers initiate needs for enterprises to undertake. |
| C2C | Consumer to Consumer | Transactions between consumers, platforms mediate, such as auction sites, second-hand trading platforms. |
| B2E | Business to Employee | Enterprises provide services, information, and goods to employees through internal platforms, such as employee portals, employee welfare or shopping platforms, online education and training. |
| O2O | Online to Offline | Online traffic or ordering, offline consumption or pickup, such as using online coupons in physical stores, food delivery and reservations. |
E-commerce trends include socialization, mobilization, and localization. The positioning function of mobile devices allows service providers to provide location services closer to the context.
KM
Knowledge management systems use information technology to support the storage, retrieval, creation, transfer, and application of organizational knowledge.
| Component | Description |
|---|---|
| Knowledge Base | Document libraries and information libraries, supporting capturing, organizing, storing, searching, and accessing knowledge. |
| Knowledge Map | Graphically presenting knowledge sources, storage locations, expert locations, tasks, and knowledge relationships. |
The two have different divisions of labor. The knowledge base is a content warehouse for storing knowledge, while the knowledge map is an index for finding knowledge, marking where knowledge is scattered, who holds it, and pointing to the knowledge base and other sources (including tacit knowledge in people's minds).
Knowledge maps are divided into three types based on how they organize organizational knowledge:
| Type | Organize Knowledge By |
|---|---|
| Conceptual Knowledge Map | Classified by concept or theme, presenting the hierarchy of knowledge and relationships between concepts. |
| Process Knowledge Map | Corresponds to enterprise processes, marking which knowledge is needed or produced by each process activity. |
| Competency Knowledge Map | Corresponds to personnel capabilities, presenting where experts are and the distribution of organizational knowledge capabilities. |
BI
BI collects, integrates, analyzes, and presents enterprise data to support decision-making. Its operating mechanism can be divided into three levels:
- Data integration and cleaning: Aggregating sources such as ERP, CRM, external data, etc., and standardizing them.
- Multi-dimensional analysis and visualization: Converting data into charts, dashboards, or interactive reports.
- Real-time monitoring and decision support: Providing alerts, scenario simulation, and KPI tracking.
CRM
CRM centers on customers, integrating data and processes of marketing, sales, and service. Main functions are divided into three categories:
- Data integration and management: Centralized integration of customer contact information, purchase records, service records, and interaction history.
- Marketing and sales support: Managing potential customers, sales pipelines, and marketing automation.
- Service and interaction management: Recording customer service interactions, providing knowledge bases, and automated replies.
Three Types of CRM
| Type | Focus |
|---|---|
| Operational | Automating front-line marketing, sales, and service processes, facing customers directly. |
| Analytical | Analyzing customer data collected by operational CRM to do segmentation, value evaluation, and behavior prediction. |
| Collaborative | Integrating customer interactions and communication across multiple channels such as phone, web, email. |
Customer Lifetime Value (LTV)
Customer Lifetime Value (LTV) estimates the total profit a customer can bring during the entire period of interaction, which is the core metric for analytical CRM to measure customer value. Under the simplified model of subscription systems, LTV = Monthly Marginal Profit × Expected Duration in Months, where the expected duration in months can be estimated by the reciprocal of the monthly Churn Rate (1 ÷ Monthly Churn Rate).
LTV Calculation Example
A SaaS service has an average revenue per user (ARPU) of $30 per month, a marginal gross margin of 80%, and a monthly churn rate of 4%. The expected duration is 1 ÷ 0.04 = 25 months, the monthly marginal profit is 30 × 80% = $24, so LTV = 24 × 25 = $600.
RPA
RPA uses software robots to simulate human operations on system interfaces, automatically executing tasks with clear rules and high repetition. It is suitable for tasks such as data entry, file movement, report generation, and data conversion between systems. It is not equivalent to AI, but can be combined with AI to handle more complex document recognition and judgment processes.
Digital Transformation and Value Creation
A business model (BM) describes how an enterprise establishes and uses resources to provide valuable products or services to customers, thereby obtaining profits and creating enterprise value.
| Aspect | Description | Elements |
|---|---|---|
| Value Proposition | Value commitment made by the enterprise to the target customer group. | Target customer group, product or service, customer value |
| Value Configuration | How internal and external resources form value creation processes. | Stakeholder network, key activities, customer relationships, distribution channels |
| Value Structure | Organizational, technical, and capability foundations supporting the business model. | Organizational structure, organizational culture, ICT, core resources, core capabilities |
| Value Finance | Cost, pricing, revenue, and profit logic. | Cost structure, pricing model, revenue structure, potential profit |
The enterprise Value Chain is a combination of activities from raw material acquisition to product or service delivery to customers. Porter's value chain divides activities into primary activities and support activities.
| Type | Definition | Included Activities |
|---|---|---|
| Primary Activities | Directly participate in the production and delivery of products or services, adding value to products link by link along the process. | Inbound logistics, operations and production processing, outbound logistics, marketing and sales, after-sales service |
| Support Activities | Do not directly produce products, but span and support all primary activities, providing the resources and foundations they need. | Procurement, human resource management, technology development, enterprise infrastructure |
Simply put, primary activities are the linear process of products from material entry to after-sales, while support activities are the common foundation that horizontally supports this process. In the diagram below, primary activities are connected from left to right, and support activities span across them, which is exactly this structure.

BPR Business Process Re-engineering
Business Process Re-engineering (BPR) is rethinking the fundamental basis of an enterprise, thoroughly renovating operational processes, so that key performance indicators obtain significant improvement.
Four points of BPR:
| Point | Description |
|---|---|
| Fundamental | Re-asking why the enterprise does this thing and why it does it this way. |
| Radical | Redesigning processes from the ground up, not limited by existing rules. |
| Dramatic | Pursuing significant improvement, not just small incremental improvement. |
| Process | Focusing on cross-departmental operational processes, not just looking at organizational structure. |
The five-step model proposed by scholars Davenport and Short:
- Establish enterprise vision and activity goals.
- Identify processes that need redesign.
- Understand existing processes.
- Determine the function of information technology.
- Build a prototype of the new process.
The eight-step model proposed by scholars Gunasekaran et al.:
- Educate employees to recognize BPR.
- Select and establish a BPR promotion team.
- Evaluate existing processes and initially establish processes that need re-engineering.
- Determine measurement methods.
- Design re-engineered processes.
- Education and training.
- Simulation testing.
- Officially introduce new processes.
Change Management: Lewin's Three-Stage Model
For significant changes like BPR to be successfully implemented, supporting change management is required. Kurt Lewin proposed the most classic three-stage change model.
| Stage | English | Focus |
|---|---|---|
| Unfreezing | Unfreezing | Establishing a sense of urgency for change, breaking status quo inertia, reducing employee resistance. |
| Changing | Changing (Moving) | Promoting new processes and new practices, providing training and support during the period. |
| Refreezing | Refreezing | Institutionalizing new practices, incorporating into performance evaluation, forming new habits. |
Kotter's Eight-Step Change Model is a more concrete implementation version:
- Establish a sense of urgency.
- Form a change promotion coalition.
- Propose a vision and strategy for change.
- Communicate the vision for change.
- Empower employees to take action.
- Create short-term wins.
- Consolidate achievements and promote more change.
- Embed new practices into organizational culture.
Change Log
- 2026-06-11 Initial document creation.